ทำหน้า Dashboard
ทำ Dashboard
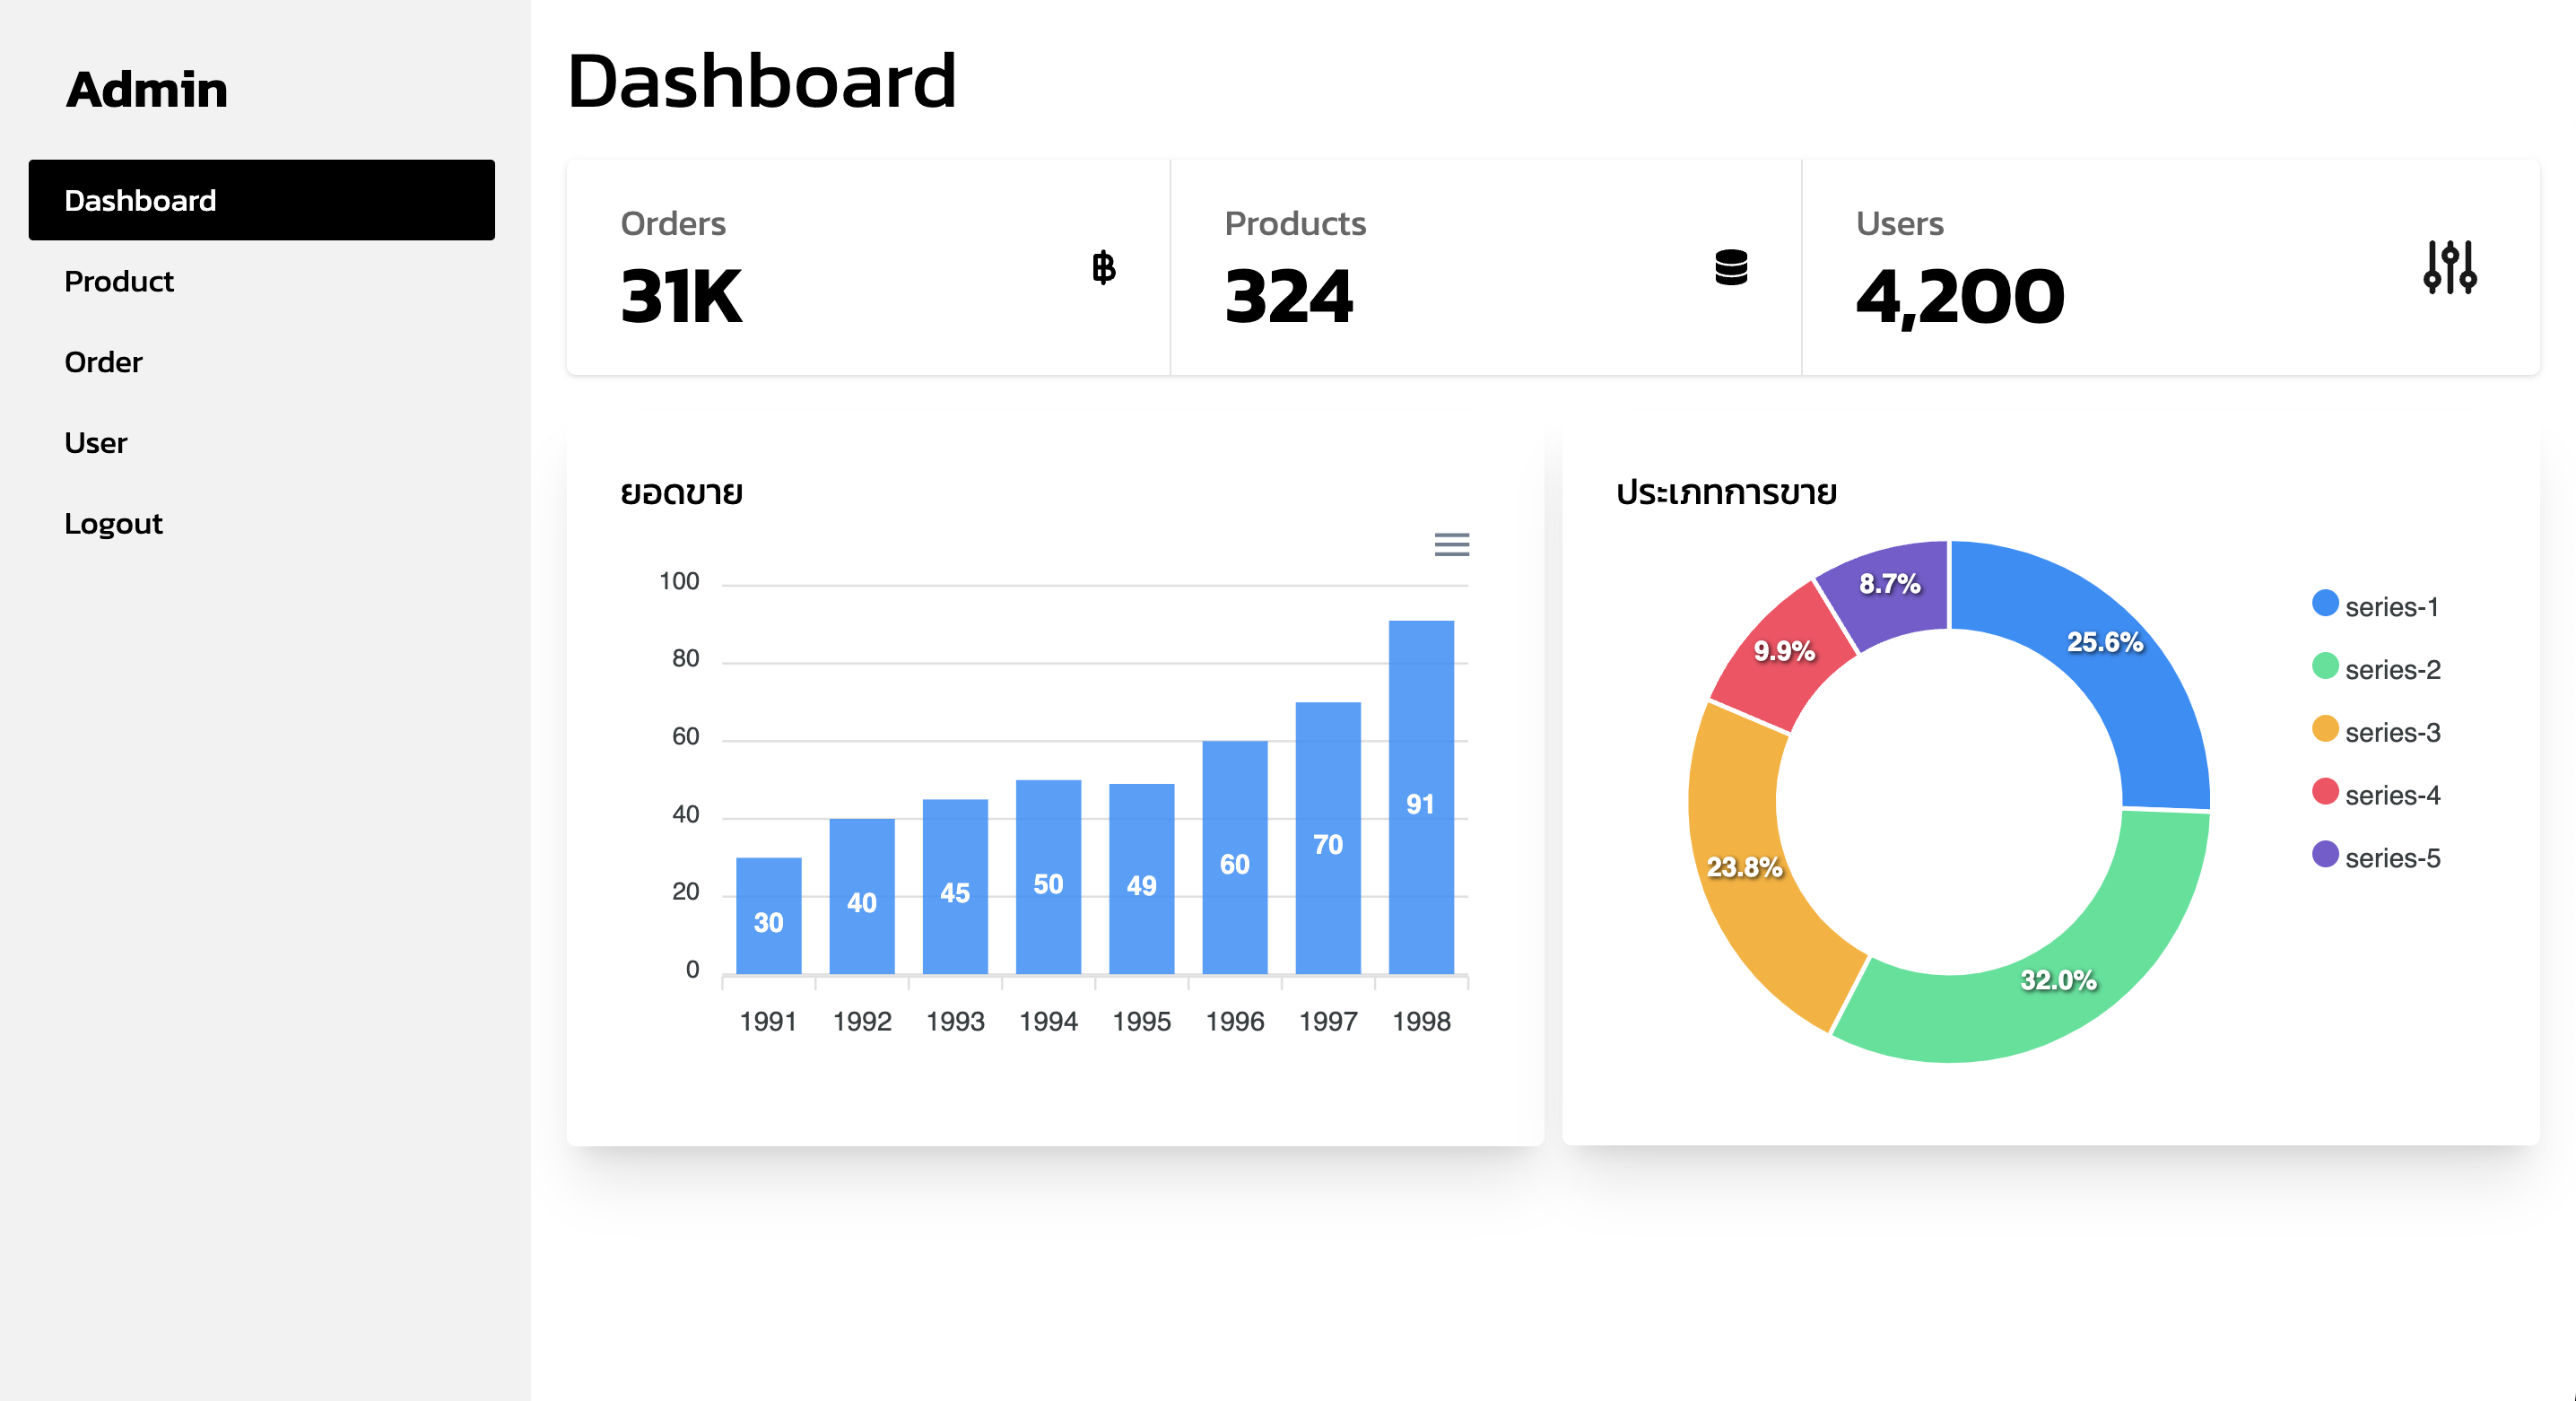
ทำหน้าแรกสำหรับการแสดงผลสถิติรวมของ Backoffice โดย
- เราจะใช้ Apexcharts กัน (https://apexcharts.com/docs/installation/)
- เพิ่ม mock ข้อมูล order, product, user เข้ามา
- เพิ่ม mock กราฟยอดขาย (กราฟแท่ง) และกราฟ Donut (สำหรับแยกประเภทยอดขาย)
ใช้ตัวอื่นๆท่ี่แนะนำ https://vue-chartjs.org/guide/
<script setup>
import AdminLayout from '@/layouts/AdminLayout.vue'

const barOption = {
  options: {
    chart: {
      id: 'vuechart-example'
    },
    xaxis: {
      categories: [1991, 1992, 1993, 1994, 1995, 1996, 1997, 1998]
    }
  },
  series: [{
    name: 'series-1',
    data: [30, 40, 45, 50, 49, 60, 70, 91]
  }]
}

const donutOption = {
  options: {},
  series: [44, 55, 41, 17, 15]
}
</script>

<template>
  <AdminLayout>
    <h1 class="text-4xl mb-4">Dashboard</h1>
    <div class="flex mb-4">
      <div class="stats w-full shadow">
        <div class="stat">
          <div class="stat-figure text-secondary">
            <svg xmlns="http://www.w3.org/2000/svg" height="1em" viewBox="0 0 320 512"><!--! Font Awesome Free 6.4.2 by @fontawesome - https://fontawesome.com License - https://fontawesome.com/license (Commercial License) Copyright 2023 Fonticons, Inc. --><path d="M144 0c-17.7 0-32 14.3-32 32V64H37.6C16.8 64 0 80.8 0 101.6V224v41.7V288 406.3c0 23 18.7 41.7 41.7 41.7H112v32c0 17.7 14.3 32 32 32s32-14.3 32-32V448h32c61.9 0 112-50.1 112-112c0-40.1-21.1-75.3-52.7-95.1C280.3 222.6 288 200.2 288 176c0-61.9-50.1-112-112-112V32c0-17.7-14.3-32-32-32zM112 128v96H64V128h48zm64 96V128c26.5 0 48 21.5 48 48s-21.5 48-48 48zm-64 64v96H64V288h48zm64 96V288h32c26.5 0 48 21.5 48 48s-21.5 48-48 48H176z"/></svg>
          </div>
          <div class="stat-title">Orders</div>
          <div class="stat-value">31K</div>
        </div>
        <div class="stat">
          <div class="stat-figure text-secondary">
            <svg xmlns="http://www.w3.org/2000/svg" height="1em" viewBox="0 0 448 512"><!--! Font Awesome Free 6.4.2 by @fontawesome - https://fontawesome.com License - https://fontawesome.com/license (Commercial License) Copyright 2023 Fonticons, Inc. --><path d="M448 80v48c0 44.2-100.3 80-224 80S0 172.2 0 128V80C0 35.8 100.3 0 224 0S448 35.8 448 80zM393.2 214.7c20.8-7.4 39.9-16.9 54.8-28.6V288c0 44.2-100.3 80-224 80S0 332.2 0 288V186.1c14.9 11.8 34 21.2 54.8 28.6C99.7 230.7 159.5 240 224 240s124.3-9.3 169.2-25.3zM0 346.1c14.9 11.8 34 21.2 54.8 28.6C99.7 390.7 159.5 400 224 400s124.3-9.3 169.2-25.3c20.8-7.4 39.9-16.9 54.8-28.6V432c0 44.2-100.3 80-224 80S0 476.2 0 432V346.1z"/></svg>
          </div>
          <div class="stat-title">Products</div>
          <div class="stat-value">324</div>
        </div>
        <div class="stat">
          <div class="stat-figure text-secondary">
            <svg xmlns="http://www.w3.org/2000/svg" fill="none" viewBox="0 0 24 24" class="inline-block w-8 h-8 stroke-current"><path stroke-linecap="round" stroke-linejoin="round" stroke-width="2" d="M12 6V4m0 2a2 2 0 100 4m0-4a2 2 0 110 4m-6 8a2 2 0 100-4m0 4a2 2 0 110-4m0 4v2m0-6V4m6 6v10m6-2a2 2 0 100-4m0 4a2 2 0 110-4m0 4v2m0-6V4"></path></svg>
          </div>
          <div class="stat-title">Users</div>
          <div class="stat-value">4,200</div>
        </div>
      </div>
    </div>
    <div class="flex flex-col md:flex-row gap-2">
      <div class="flex-1">
        <div class="card w-full p-6 bg-base-100 shadow-xl">
          <h1>ยอดขาย</h1>
          <apexchart type="bar" :options="barOption.options" :series="barOption.series"></apexchart>
        </div>
      </div>
      <div class="flex-1">
        <div class="card w-full p-6 bg-base-100 shadow-xl">
          <h1>ประเภทการขาย</h1>
          <apexchart type="donut" :options="donutOption.options" :series="donutOption.series"></apexchart>
        </div>
      </div>
    </div>
  </AdminLayout>
</template>
ผลลัพธ์ของหน้า Dashboard